

Introduction
Organized retail crime (ORC) remains a growing challenge for retailers across the country. According to The NRF’s 2024 report, The Impact of Retail Theft & Violence, more than three-quarters (76%) of retailers say that ORC shoplifting has grown as a concern in the last year. But do consumers feel the same way? And, if they do, is it influencing their shopping behavior?
To find out, Flock Safety and Zencity partnered to conduct a nationwide survey, alongside focused research in the Seattle and Chicago metro areas, to assess consumer sentiment on shopping and safety. Together, 3,522 respondents were surveyed over a three-week period from December 21, 2024 to January 13, 2025.
Key Findings
Consumers are concerned about growing retail crime. In line with retailers’ concerns, consumers also perceive a growing threat of retail crime. The survey reveals that approximately one-third of nationwide respondents consider shoplifting and organized retail crime to be serious issues.
 Retail crime is influencing shopping preferences. The growing concerns around shoplifting and organized crime are pushing consumers toward online shopping, reshaping the retail landscape.
When asked to consider the impact of these concerns, most nationwide respondents indicated a preference for online shopping over in-person shopping.  Similarly, respondents who have seen organized retail crime are more likely to shop online than those who have not.
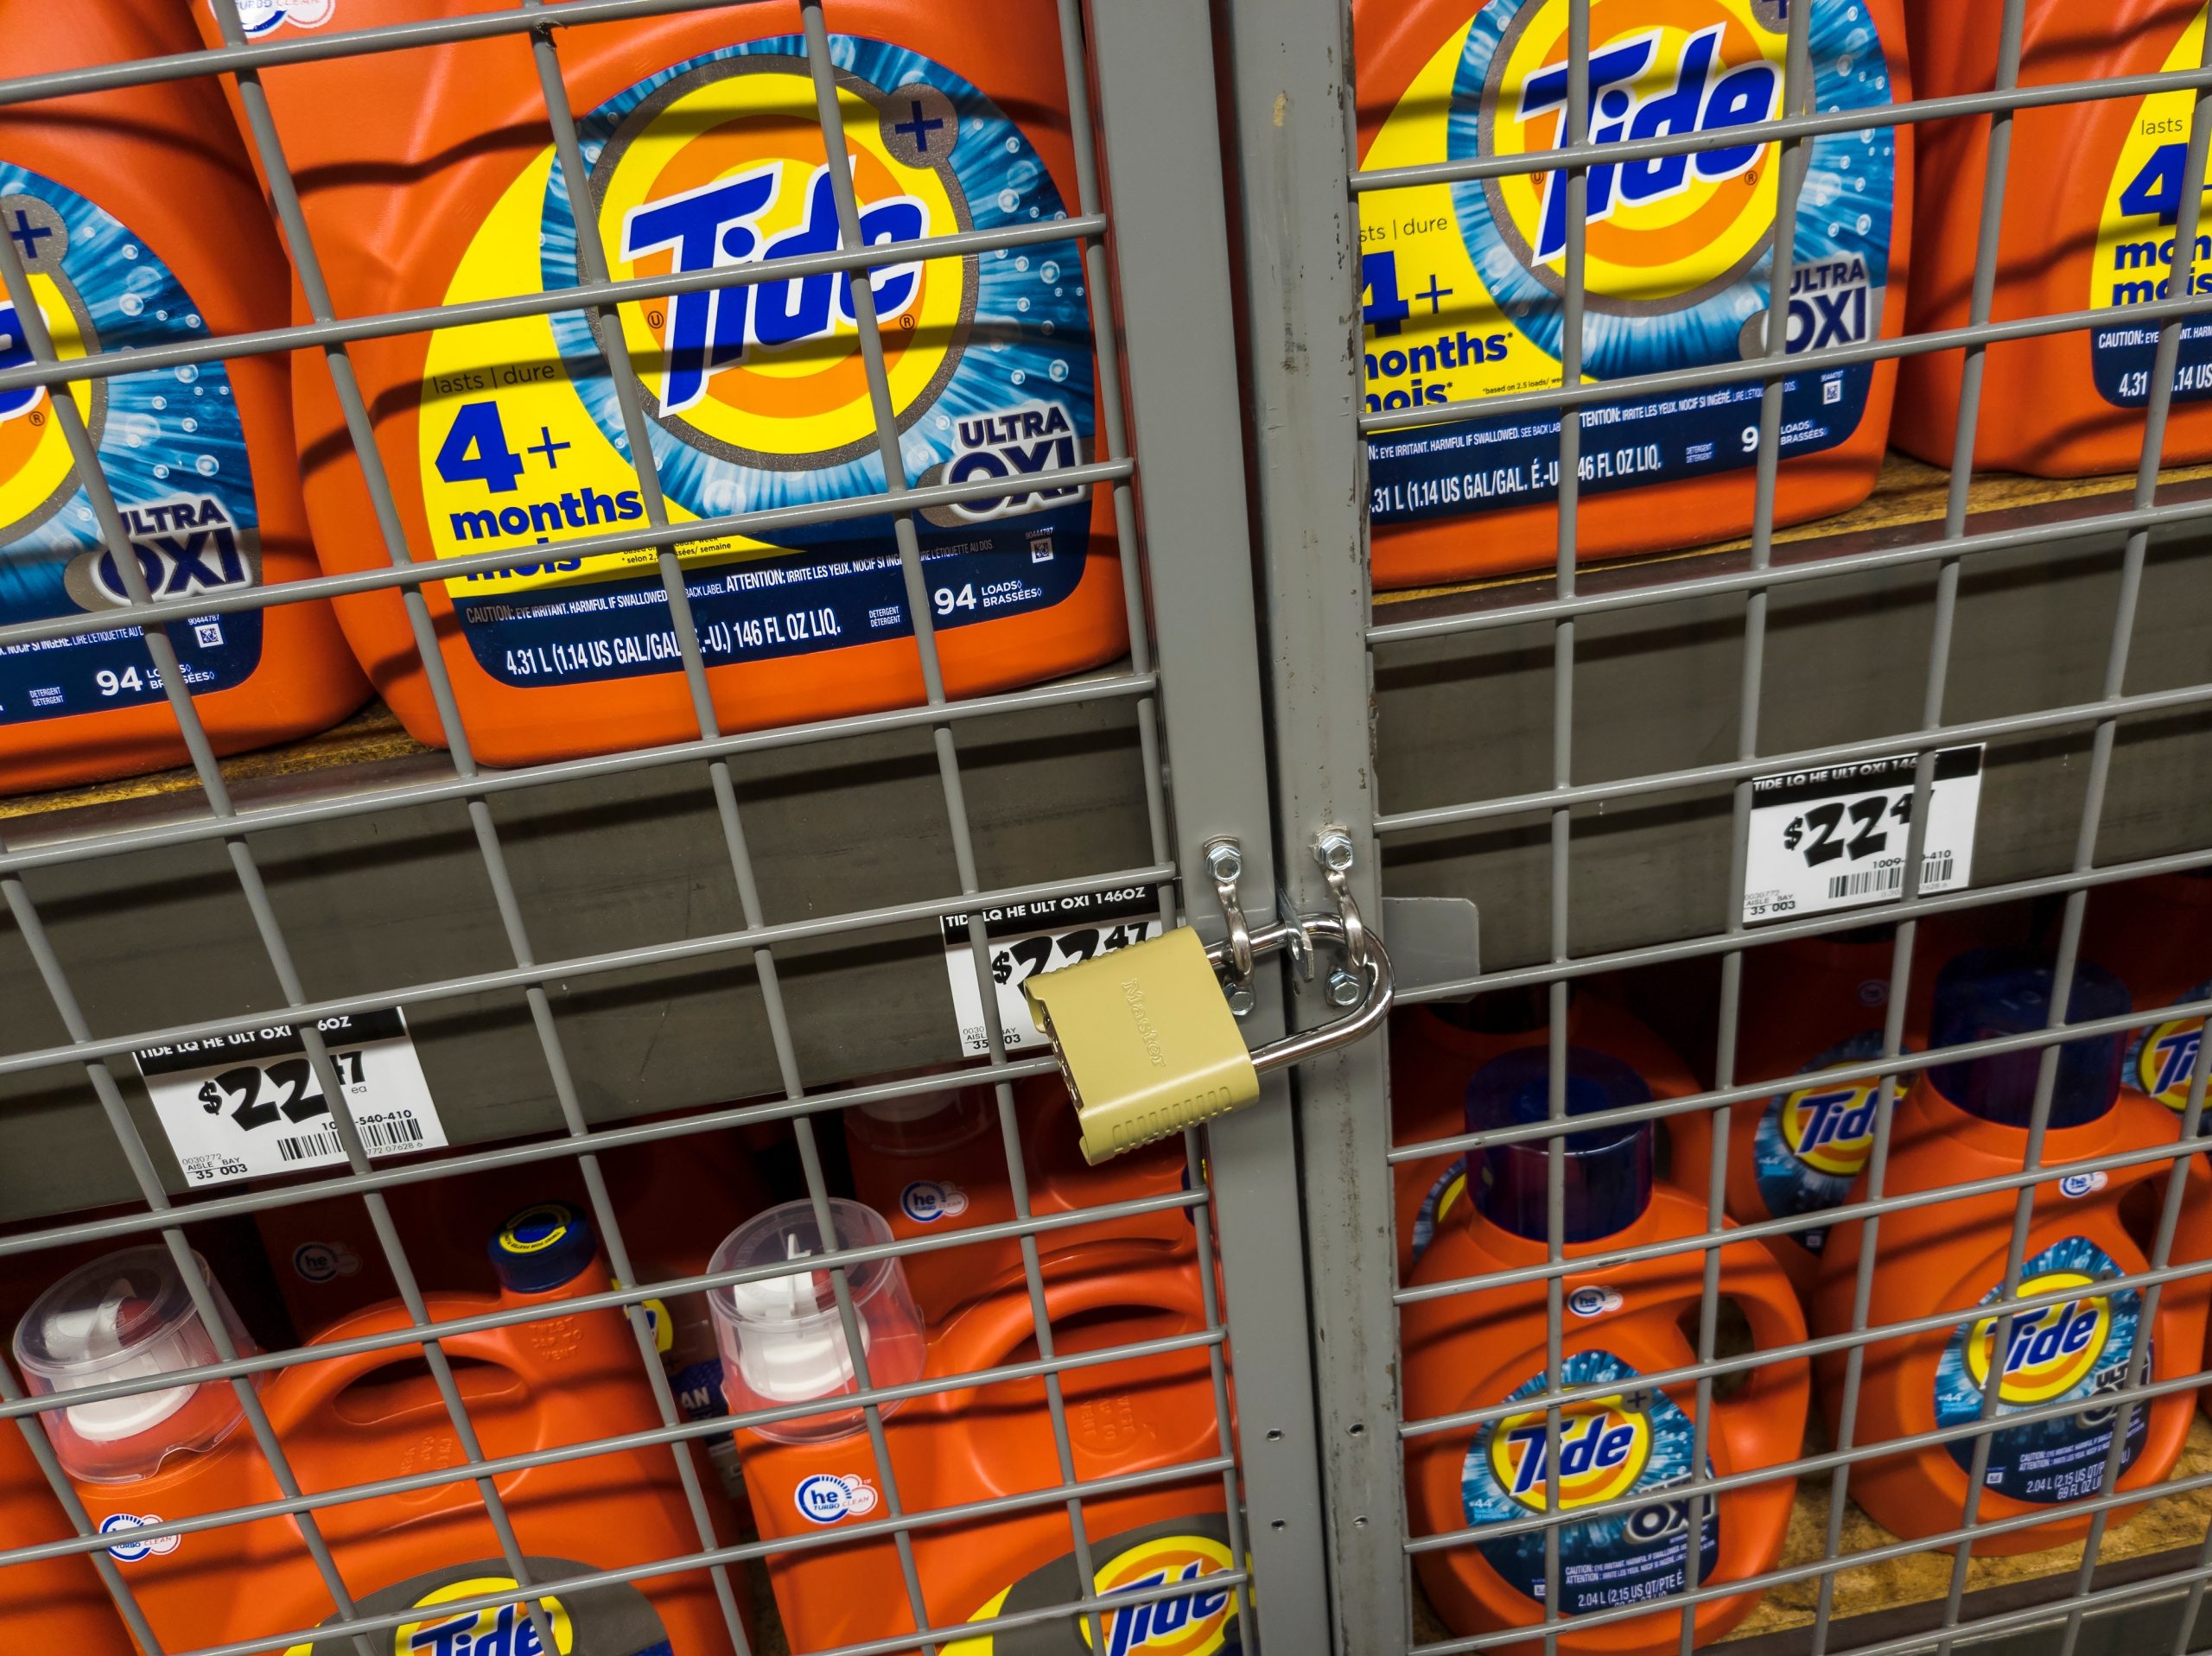
 The study also shows that more than half of respondents reported it took them more than 5 minutes to get the items they wanted in stores with locked merchandise.

Broad support for using technology to address retail crime: Consumers are increasingly aware of the changing technology being used and the role it can play in mitigating ORC and creating a safer shopping environment. Survey results also show widespread support for technological solutions that enhance safety for both customers and employees —a key component of Flock Safety’s mission. Survey results show that nearly half (45%) of nationwide respondents are likely to support the use of technology to combat shoplifting and organized retail crime.
 As retail crime concerns rise, technology helps reassure consumers by enhancing security measures, fostering trust, and encouraging them to return to brick-and-mortar stores.
The survey indicates that live and recorded security videos (62%), and license plate recognition cameras (54%) could play a significant role in increasing shoppers’ sense of personal safety.
 When asked specifically about LPR cameras, just over half of respondents believe that they effectively prevent ORC and shoplifting.

Conclusion
The data from this survey shows that—like retailers—consumers are increasingly concerned about shoplifting and organized retail crime. This has led to a shift in shopping preferences, with more consumers opting for online shopping over in-person shopping. Furthermore, there is growing support for using technology to address these concerns.
Consumers feel that technologies such as live and recorded security videos and license plate recognition cameras will increase their sense of personal safety. As retail crime continues to be a concern, technology can play a crucial role in improving in-store security, fostering trust among consumers, and encouraging them to return to physical stores.
Methodology
Sample
3,522 respondents (1,282 respondents for national survey, 1,034 for Seattle area, and 1,205 for Chicago area) were recruited between December 21st 2024 and January 13th, 2025 using targeted ads on various platforms (e.g., social media, apps for Android and IOS) as well as online survey panels. Using data from the US Census Bureau, this survey employed quotas to match the distribution of race, ethnicity, age, and gender in the US, ensuring that the sample represents the entire population of the country (in the case of the national survey), or the specific metro areas surveyed.
Weighting
To make sure our sample is representative, a technique called rake-weighting was used to balance out any remaining differences between the makeup of the survey respondents and the community. This process serves as a statistical safeguard against any demographic group being overrepresented or underrepresented in the final score calculations by giving overrepresented groups a lower weight and underrepresented groups a higher weight in the analysis.


