



Government leaders make high-stakes decisions every day on budgets, service priorities, public communications, and community needs.
To make decisions with confidence, they need data that provides credible evidence they can trust. Zencity’s managed surveys deliver exactly that: representative data on the communities government teams serve.
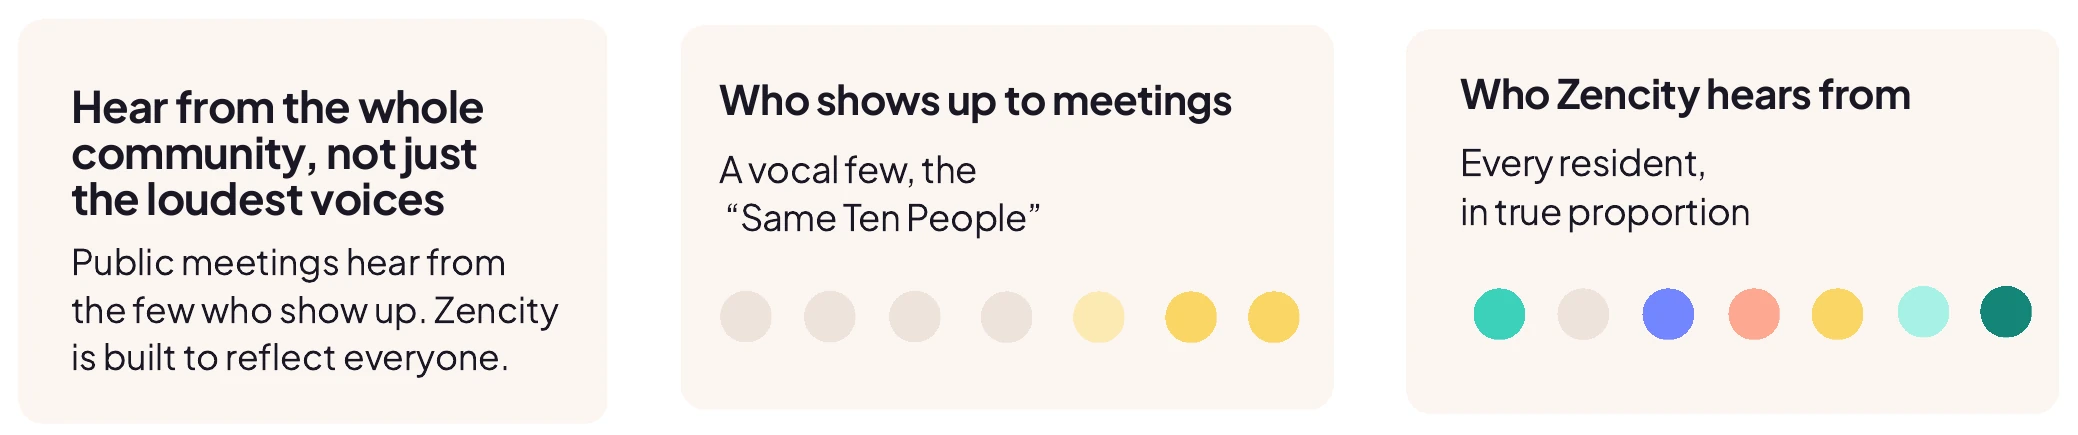
Representativeness makes data sound. Because we ensure our survey reporting reflects the full community and not just the voices that show up to public meetings, government leaders can rely on it to shape and explain their decisions. These findings can be tracked over time or benchmarked against data from other communities.
A unique advantage of Zencity’s approach is how quickly we produce representative data. Unlike traditional survey methods that rely on mail or interviewer-administered surveys, our digital distribution and automated data processing allows us to quickly design a custom survey to address issues specific to a community and deliver results as soon as a month from finalizing the questionnaire. Throughout that process, our samples remain representative of the community as a whole and can be made representative of specific subdivisions within the community as well.
How we produce representative data¹
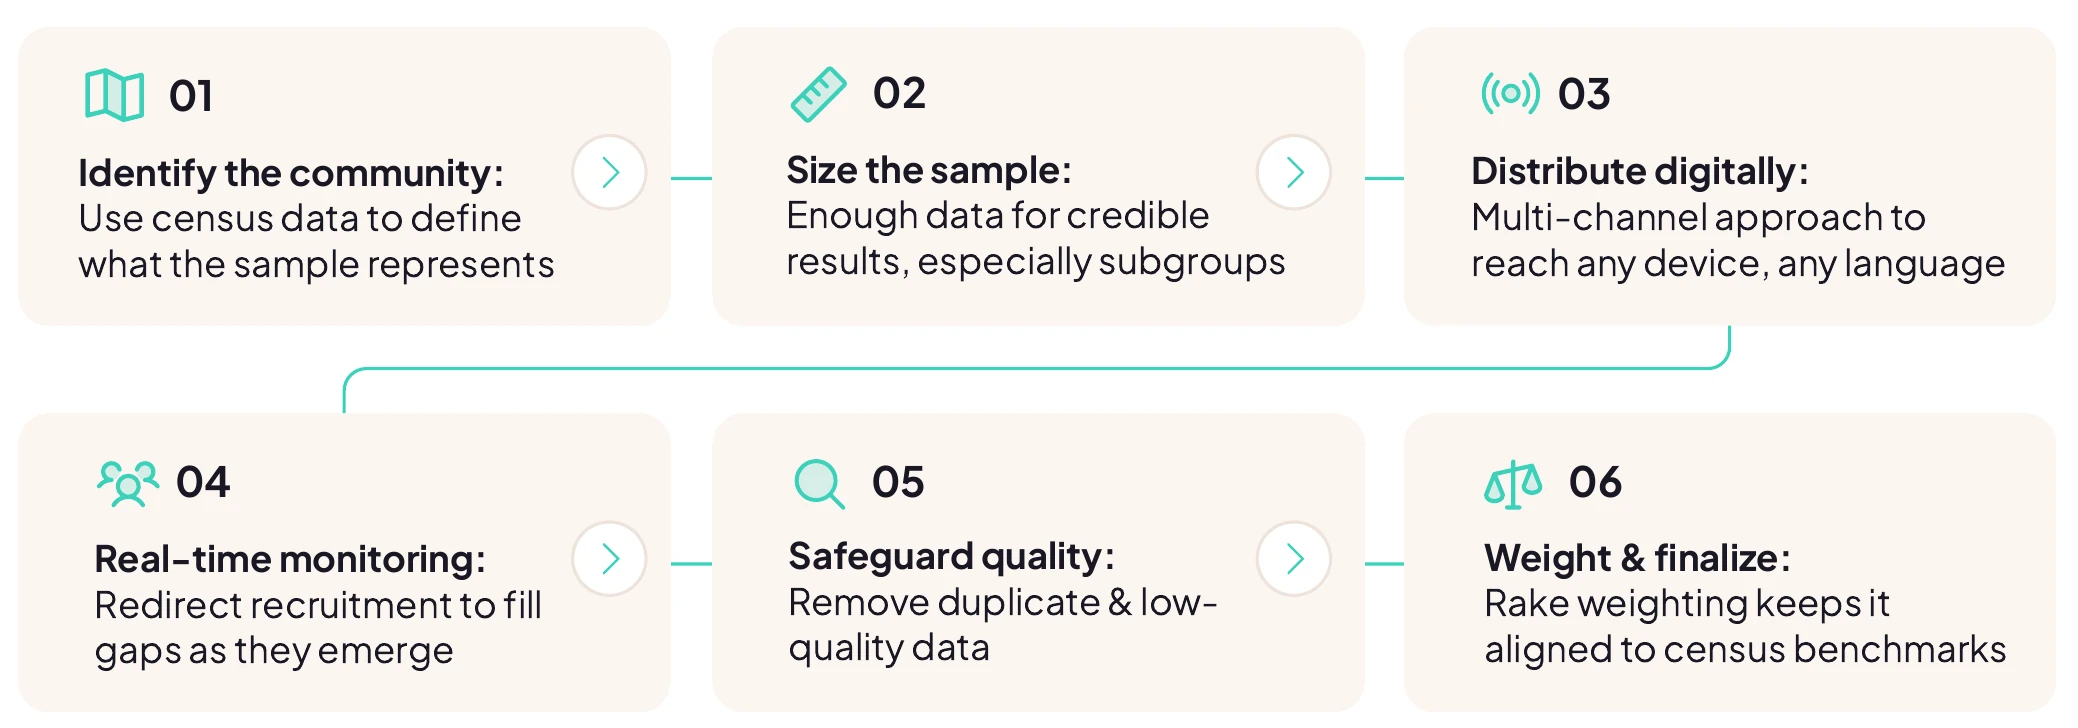
Our primary tool for ensuring representativeness is a rigorous, multistep process for designing, distributing, and processing survey data.
01
Identify the community
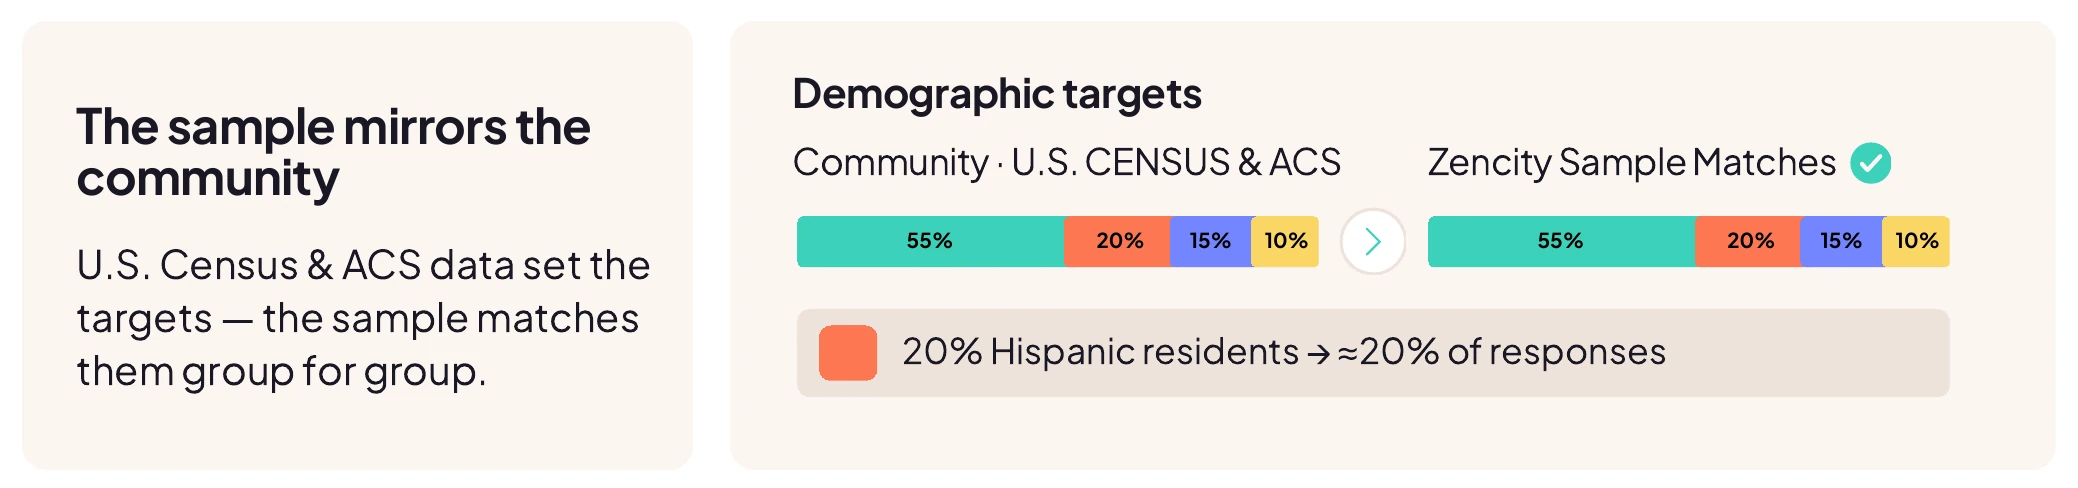
We work with government teams to identify the geographic or administrative areas (e.g., police district, city, county) that make up the community. We use national statistical data such as the U.S. Census and American Community Survey to establish the number of adults in each age, gender, and race/ethnicity group within the community.
This information determines how our sample should be distributed across these groups. For instance, if the Census shows that 20 percent of a community’s residents are Hispanic, the survey should be based on a sample where approximately 20 percent of responses reflect the perspectives of Hispanic residents. We use this data, together with information on sample size, to set the minimum number of responses required from each group.
02
Determine sample size based on how the data will be used
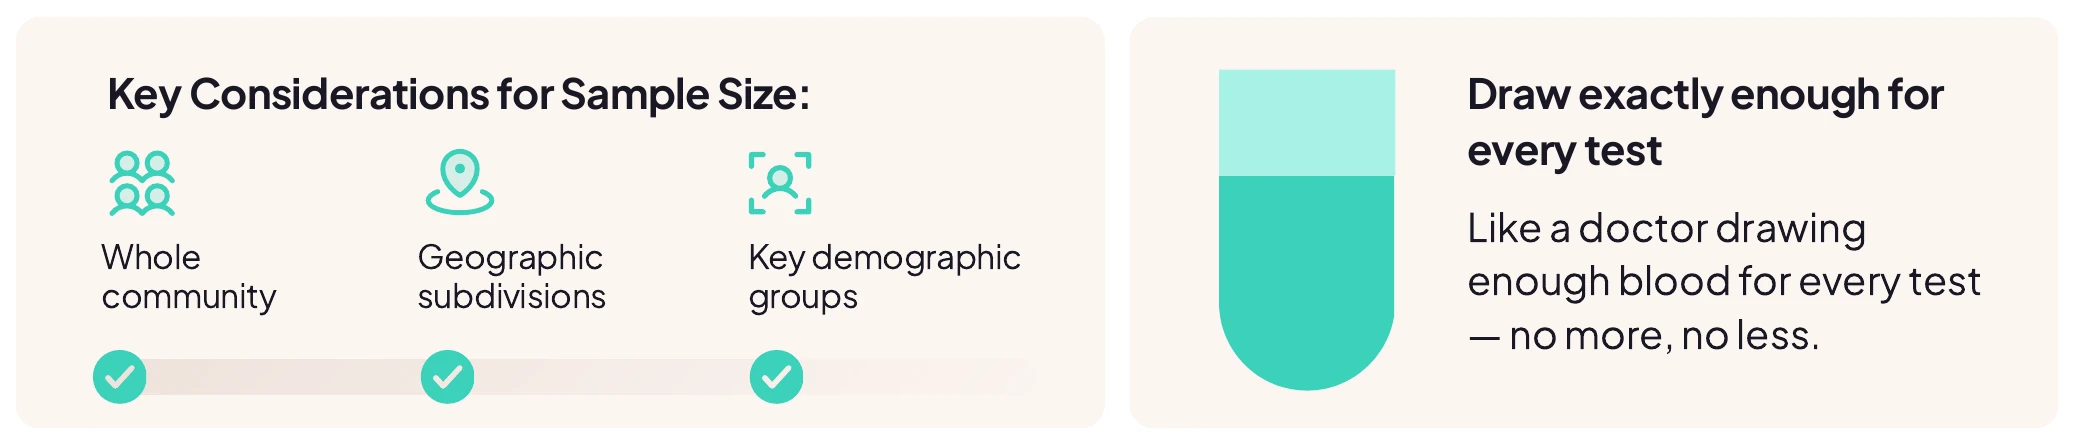
Sample sizes include enough data on groups that government teams need to understand. This could include their community as a whole, geographic subdivisions, and key demographic groups. These samples produce results that are credible enough to be used for informed decisions.
This step draws on statistical guidelines for survey sample sizes and is akin to determining how much blood needs to be drawn from a patient to test for a particular health condition. We then adjust the sample size to ensure we can produce reporting that matches the team’s needs. For instance, if a team needs representative data for particular subdivisions of the community, we will choose a sample size that can describe those areas reliably, exactly like making sure there’s enough blood drawn for all the tests a doctor would conduct.
03
Distribute the survey digitally and accessibly across many channels
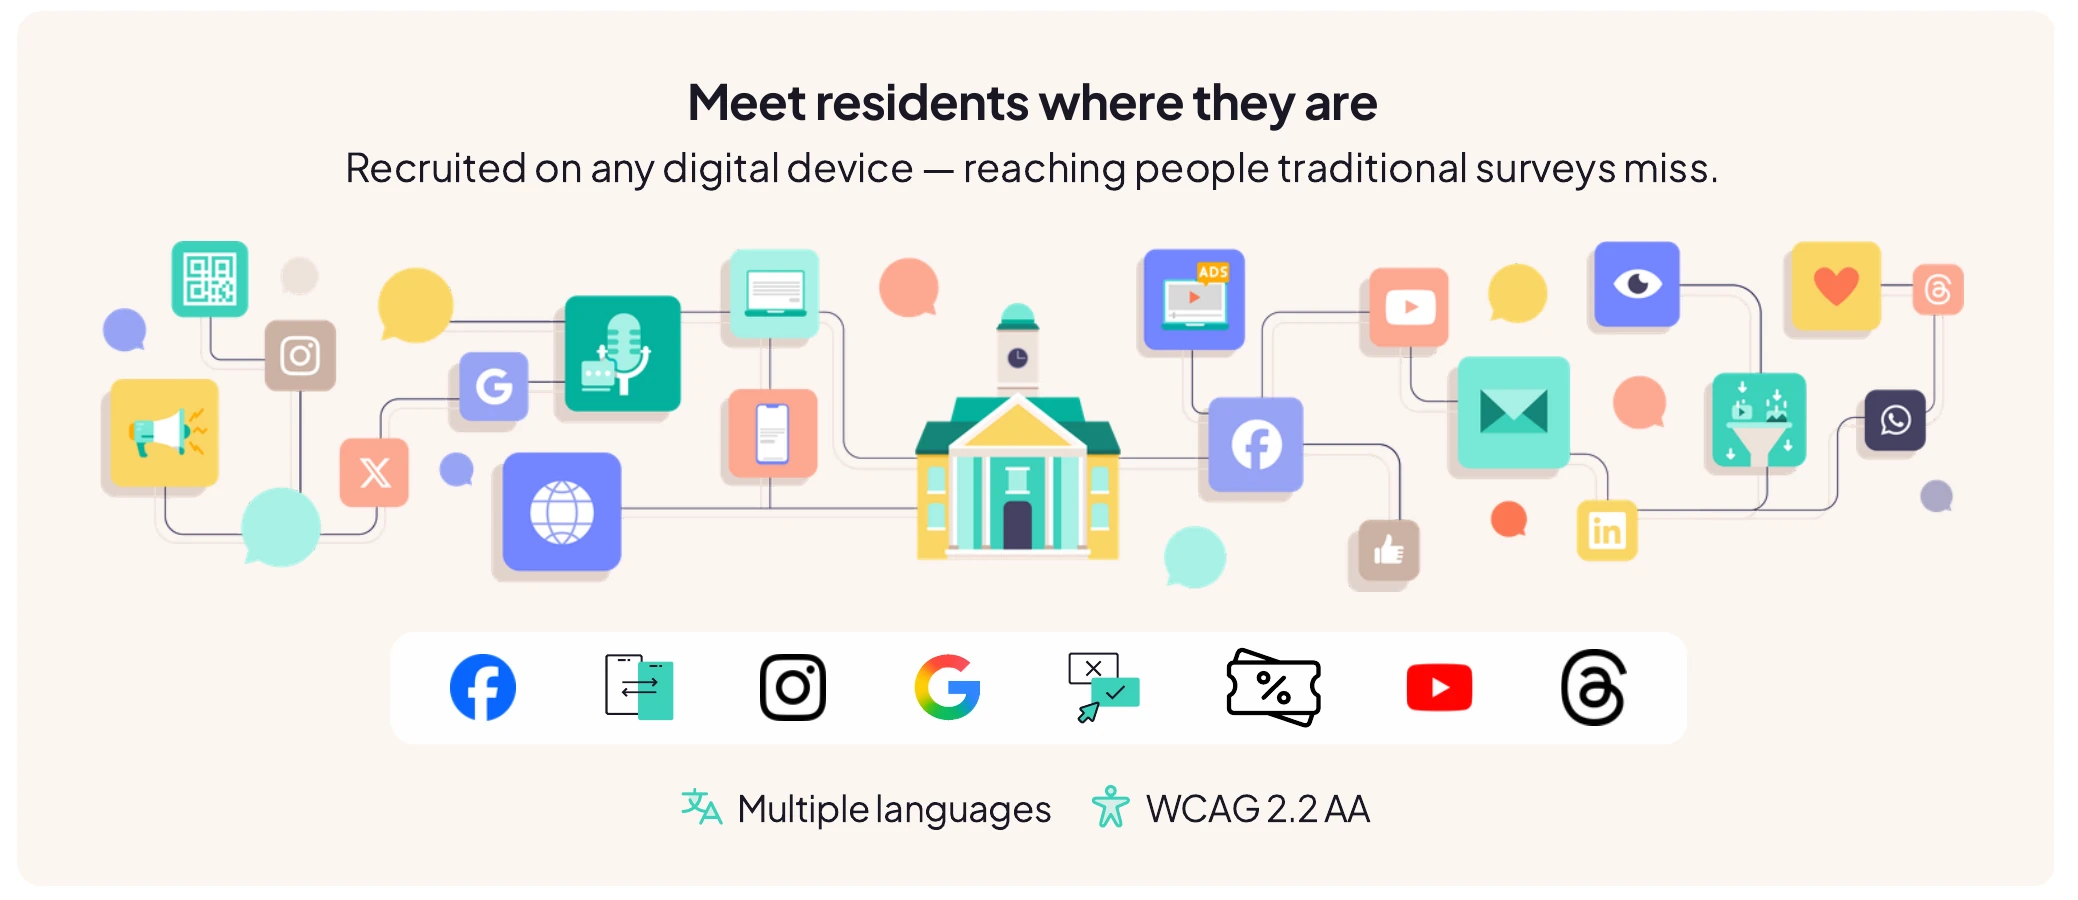
Our goal is to give every resident with digital access the opportunity to participate. To do so, Zencity recruits survey respondents where the vast majority of residents can be most readily reached: on any digital device. Respondents are recruited with the help of targeted ads on social media, mobile apps, and survey panels. Our survey application is WCAG 2.2 AA accessible, mobile-native, and supports multiple languages, so that residents are able to participate regardless of language or ability. This allows us to more effectively engage hard-to-reach populations compared to traditional phone and mail surveys.
04
Real-time dynamic monitoring
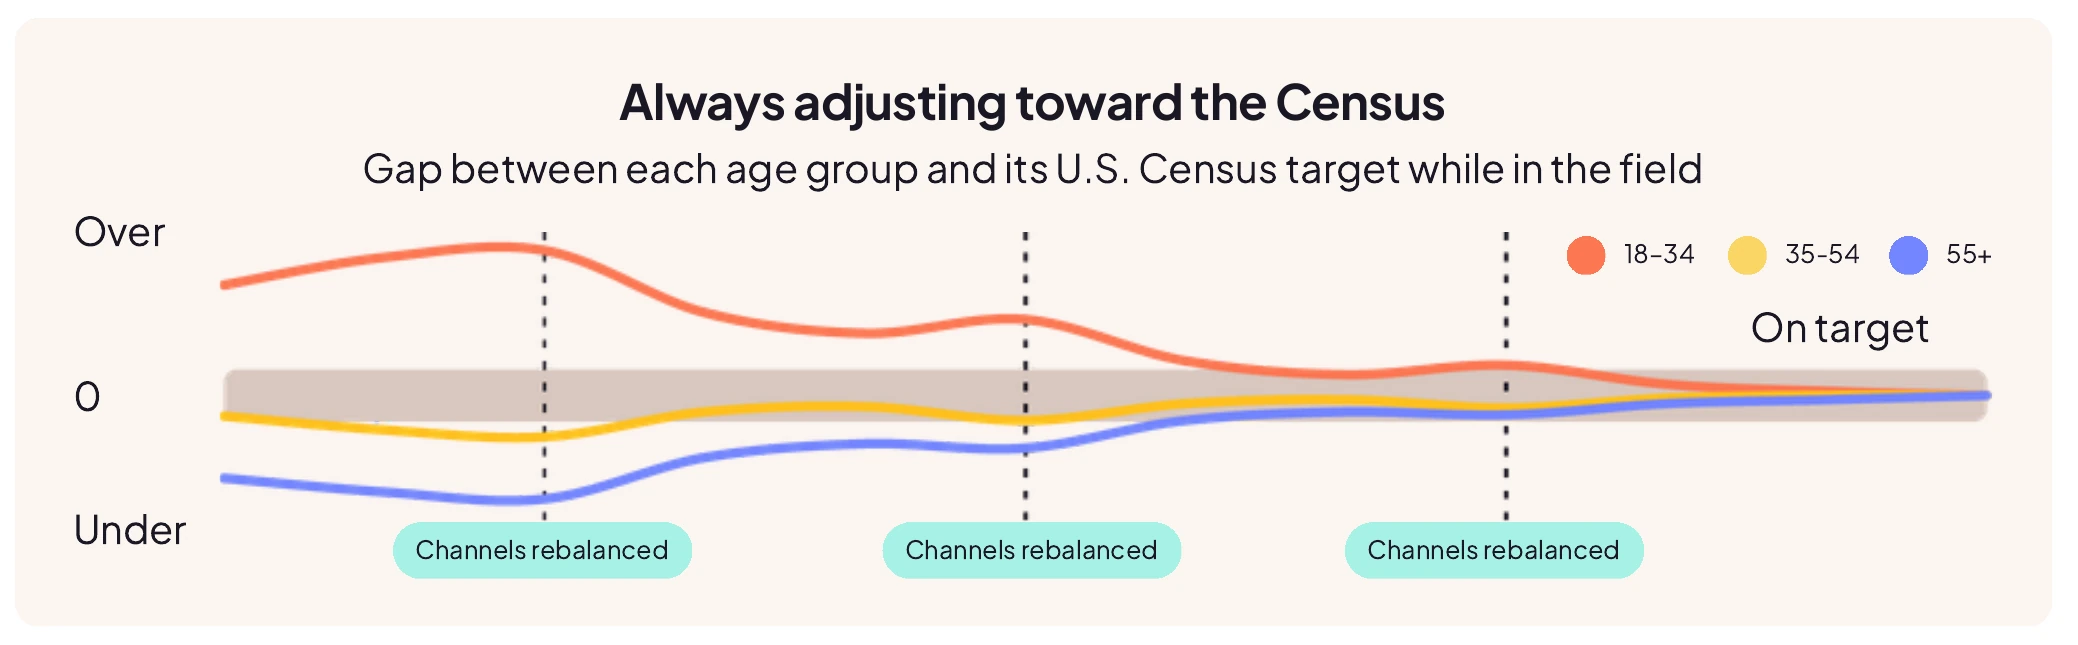
As the survey is in the field recruiting across the population, we monitor and adjust how we invite respondents. This means if at any point one specific demographic is responding more on mobile apps, we will adjust the effort we spend to recruit from this specific channel for this demographic.
This allows Zencity to recruit a diverse pool of residents that ensure we meet the sample targets that align with each community’s population profile as defined by the US Census.
05
Implement checks and adjustments that safeguard response quality
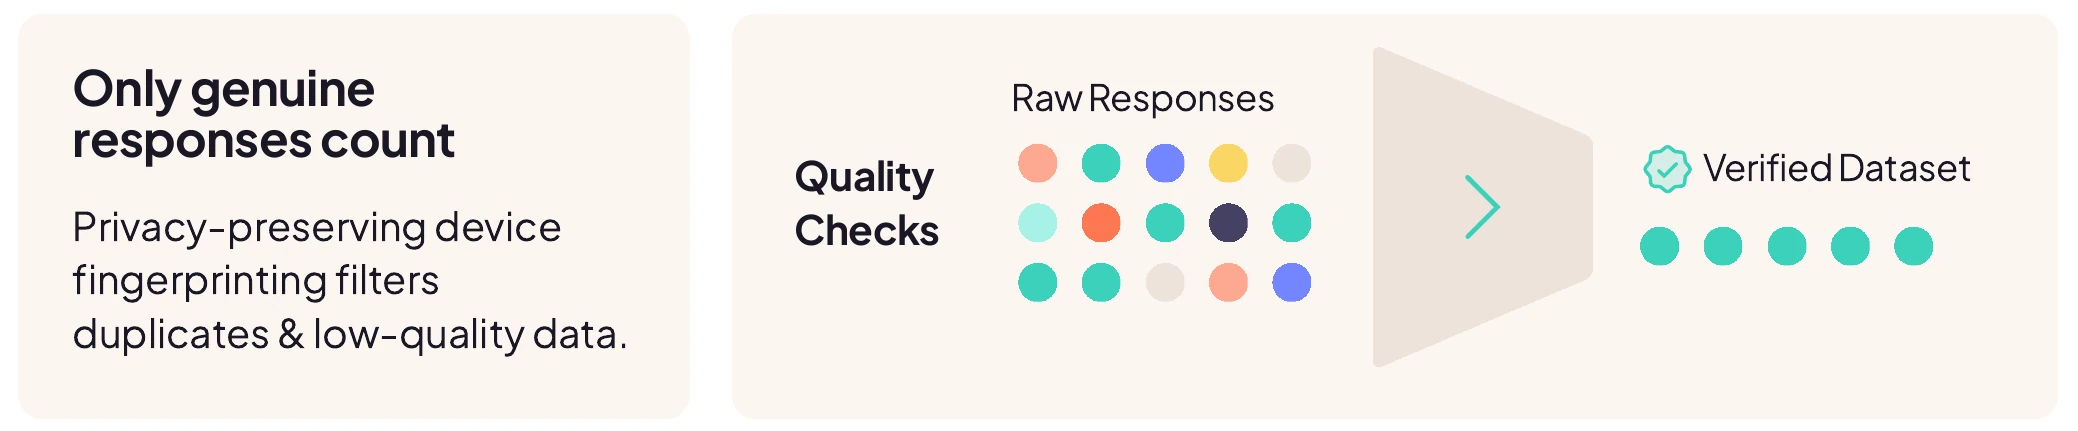
After distribution, we apply checks that ensure the data are generated by residents and are high quality. For instance, we use device fingerprinting, a privacy-preserving process that analyzes respondents’ metadata, to prevent duplicate submissions.
In some cases, we respond to these checks by removing low-quality data from the sample, so that erroneous responses don’t lead to inaccurate conclusions.
06
Produce weights to correct for deviations that arise during distribution
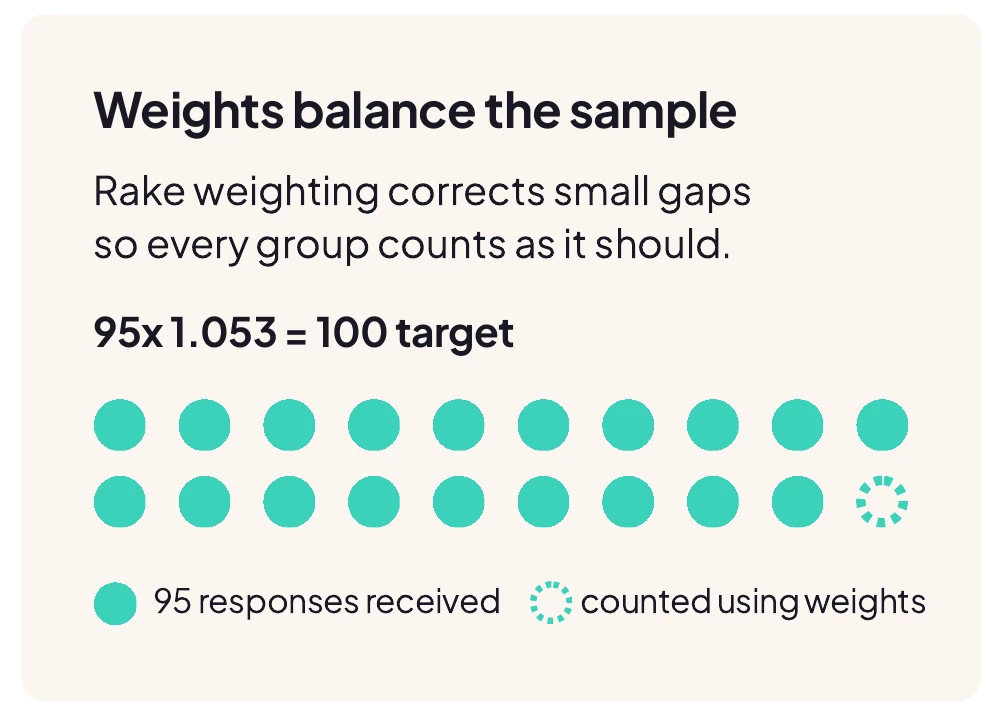
When we receive slightly more or slightly fewer responses than anticipated for some demographic groups, we use rake weighting, an industry-standard approach, to correct for these discrepancies. Weights align the data to the targets we established earlier by determining how much each response should count to maintain representativeness.
If the sample should have 100 residents ages 18–34 but we obtain responses from only 95 such residents, the weights may count each of those responses for about 1.053. With weights, the 95 responses would be counted as 100 responses (as 95 × 1.053 roughly equals 100). Our standard weighting takes age, gender, race, and ethnicity into account.
What this means for government work
Our process is grounded in established survey science and purpose-built for the rapid pace of government work, which means leaders get credible data on community needs faster than traditional methods allow.
When a department head needs to justify a funding allocation, when a city manager faces a council challenge, or when a communications team needs to explain a difficult decision, Zencity provides the data that makes those decisions credible.
Built to fit the workflows where decisions and accountability already live
¹ Our approach to producing representative data uses non-probability sampling with quotas. In recent years, academic research has shown that non-probability samples are an alternative that can be as or more accurate than probability surveys in many contexts (Fehsenfeld, Lewitus & Kull, 2024; Mercer et al., 2017; Kennedy et al., 2016). Evidence suggests that key design features lead to increased accuracy, such as those we detail in the rest of the document (Enns et al., 2024; Mercer & Lau, 2023).
Ready to power your work with community voices?
See Zencity on your own community's data.