Monitor and manage reopening discourse data in your city with our Coronavirus Project Dashboards
Zencity
The Platform for Community Trust
share this article:
As cities start to move bravely into the next phase of managing the COVID-19 crisis, it has never been more critical for local governments to maintain a clear overview of discourse in their cities, and proactively tackle misinformation as they start to reopen economies.
There is no one-size-fits-all approach to addressing the issue of reopening and how to navigate the safe return to an open economy. In consequence, it is vitally important that local governments keep their fingers on the pulse of the public discourse in their cities.
Zencity is here to help you during this crisis by unlocking the critical insights found in the online discourse about COVID-19 in your city, so you can understand developing trends, tackle misinformation, and use the data to create actionable insights to empower your teams and decision-making.
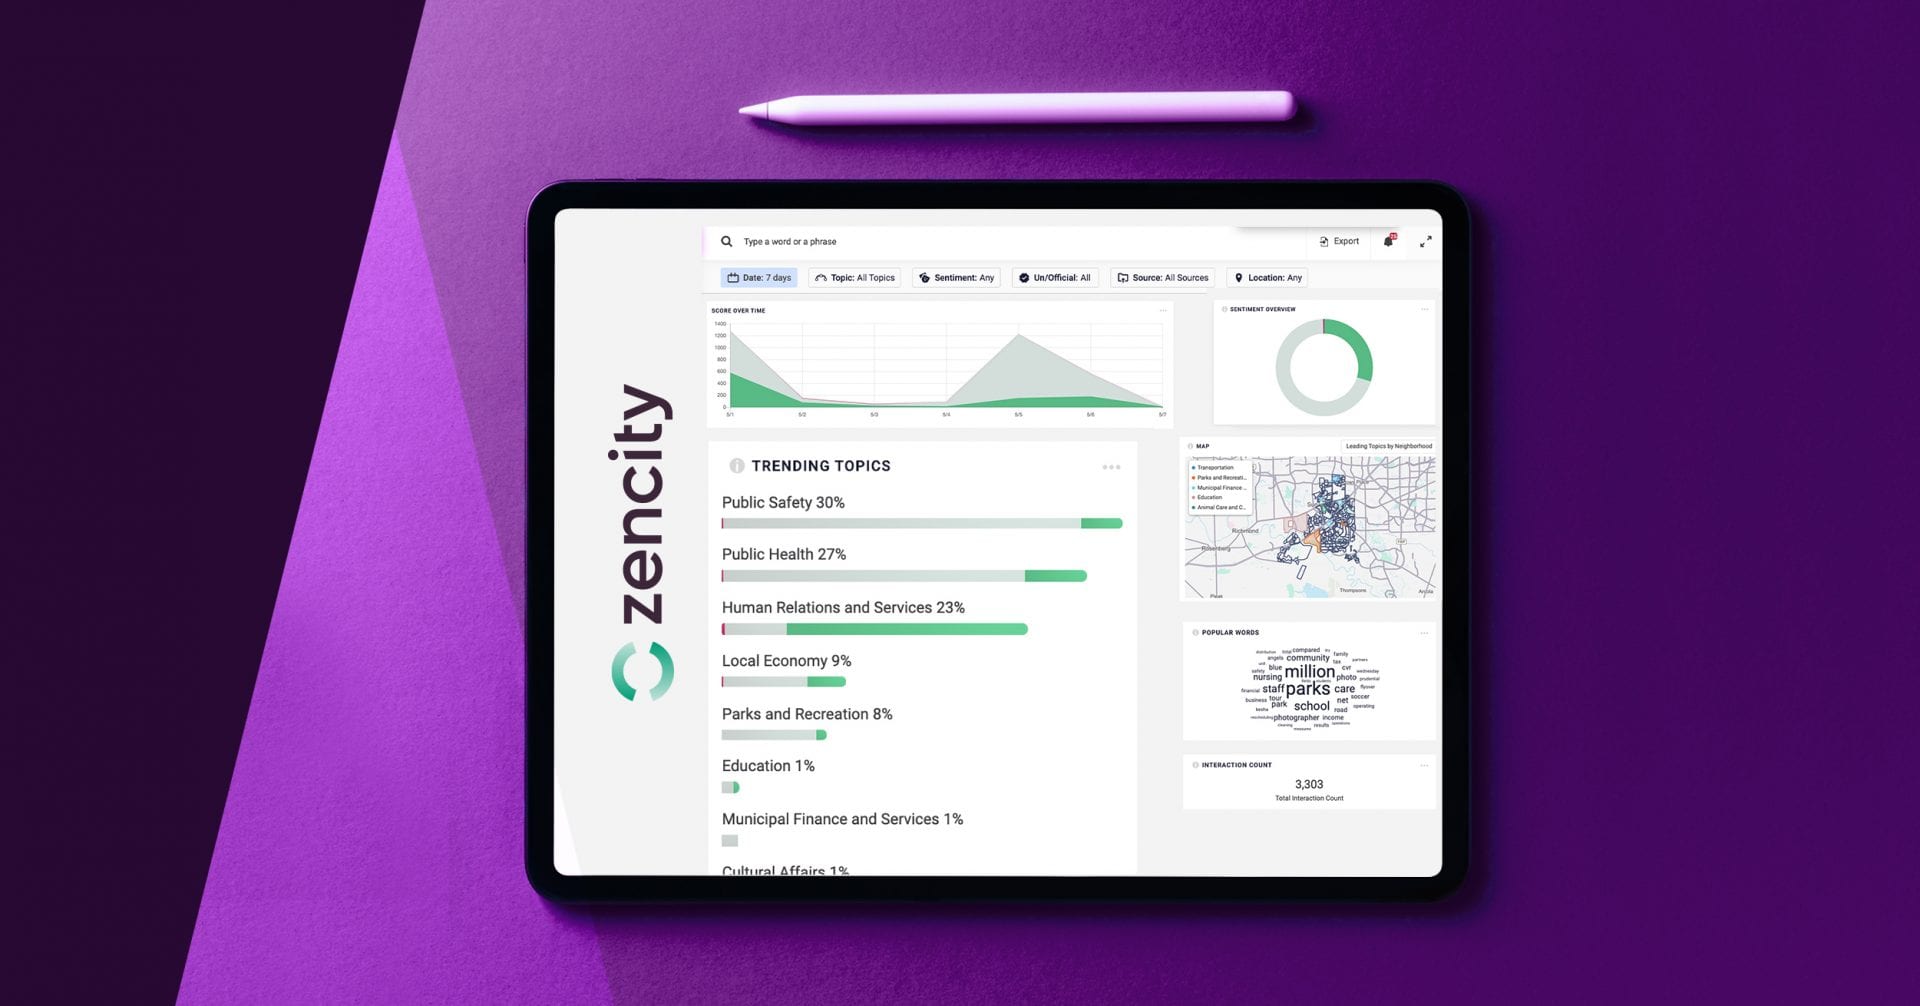
What do the Coronavirus Project Dashboards help me do?
Our Coronavirus dashboards are designed to give you a complete overview of public discourse in your city that you can use with ease, so you can:
Keep track of the most important trends
With a variety of dedicated dashboards that are built to filter online discourse about Coronavirus, you can see at-a-glance which issues are trending in your city. Our project dashboards are equipped with filters so you can sort the data by date, sentiment, source, and more, giving you the ability to see how trends evolve over time.
Performance management of city education & communications
You are also able to filter the data by official and unofficial sources so you can gauge the impact of the official messaging of your city, and how closely it relates to the trending topics and discussions in the public discourse
Identify and manage misinformation
While the city is communicating important information via online channels, it is vitally important to understand if any misinformation or disinformation is also being spread in your city. Using our project dashboards, you can detect trending posts that disseminate incorrect information and jump on this quickly to ensure your community remains aligned when it comes to understanding protocol – particularly as cities move forward with reopening plans.
Communicate and share data trends with remote teams
The effective distribution of data trends between teams and departments vitally important while teams are working at a distance. Rather than navigating endless webpages to compile your reports, you can create a brief directly from within your Coronavirus Project and send directly from the Zencity dashboard to your remote teams.
“[Using the Zencity Dashboards] we can see how our messaging is aligning with what our residents are talking about, and use it to determine what our messaging should be for the following week.”
Whitney Skillman
Communications Technician from the City of Fairfield, CA.
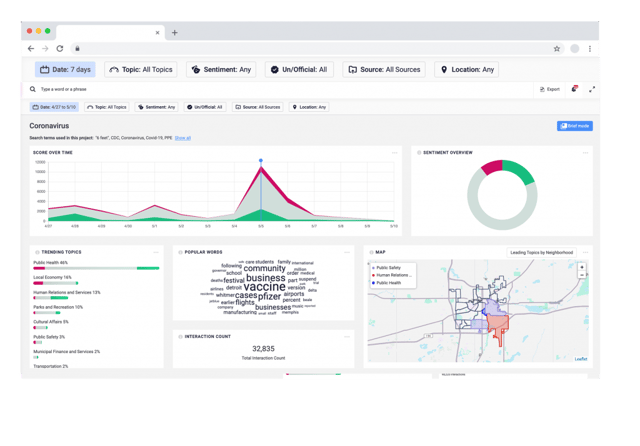
How do the Coronavirus Project Dashboards work?
Our Coronavirus projects include a series of dedicated dashboards for different trending sub-topics of discourse, including reopening,social distancing, local economy, and more.
Zencity collects and aggregates millions of resident and city-generated data points from a multitude of external and internal sources like social media, local news channels, 311, and more, to give you a comprehensive overview of public discourse about COVID-19 in your city.
Your project dashboards then present these data points in an easy-to-use interface so that you can understand at-a-glance resident sentiment toward key COVID-19 issues, and any trending topics among your community – such as questions around reopening, and changes in safety protocol within the city.
Our COVID-19 dashboards feature a series of sub-topics, so you can save time having to cover every aspect of the COVID-19 crisis. Each sub-topic contains custom-built parameters that aggregate all the relevant data for a specific topic of the COVID-19 discourse, which you can then use to pinpoint any issues or concerns that are more unique to your city.
Stay informed with daily reports
In addition to your Coronavirus project dashboards, we’ve created a COVID-19 Daily Digest to deliver an overview of COVID-19 online discourse in your city straight to your inbox every day.
The COVID-19 Daily Digest aims to provide you with a snapshot of online interactions, popular posts, and an overview of public sentiment in your city each day, so you can:
Identify highlights in online discourse from both official and unofficial sources
Understand the relative volume of discourse from one topic to another, and see which topics are trending
Click directly through to your Zencity coronavirus dashboard for a closer look
Easily forward top stories and discourse trends to colleagues and city leadership
If you would like to learn more about how Zencity’s 130+ local government network is leveraging our technology to handle their COVID-19 response management and using its insights to make informed decisions as new virus regulations emerge, visit our Coronavirus Action Plan Page.
.png)